Why Your SPC Charts Stay Green While Your Castings Keep Failing
9 min read · By Vijay Gurunath, Founder, ForeCAST · Published 2026-03-24
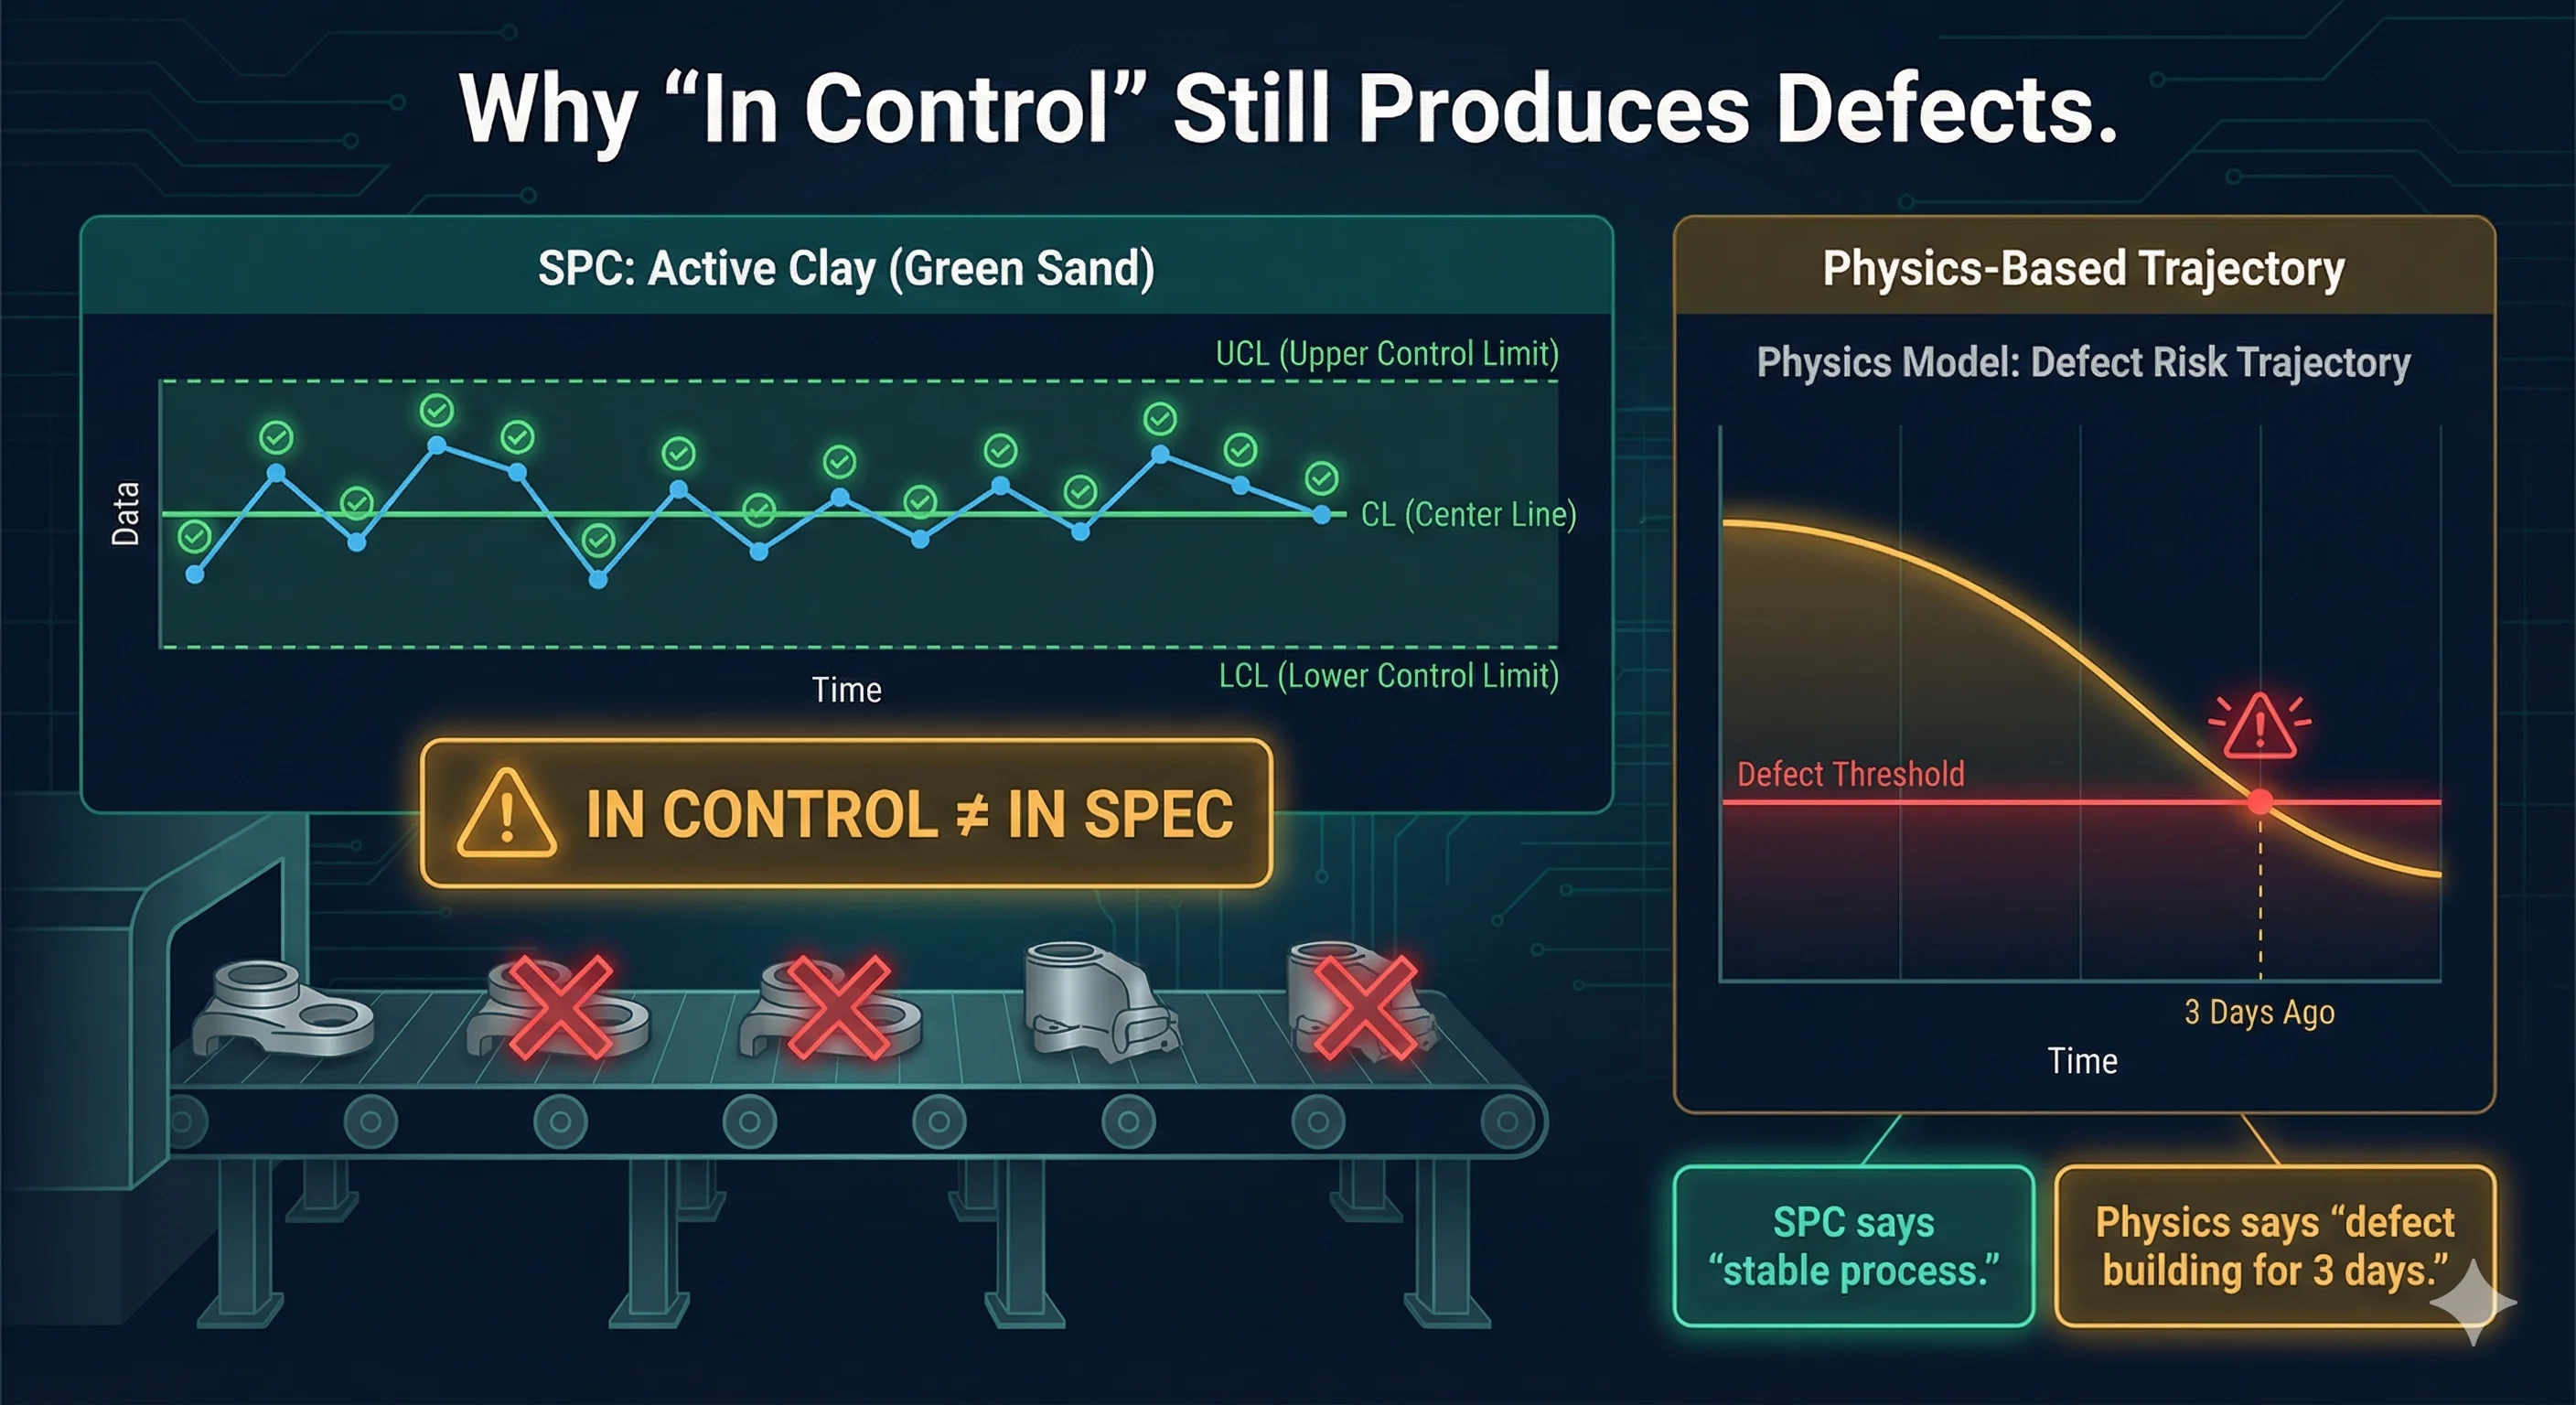
Active Clay, LOI, GCS, GSS, WTS, compactability, moisture. Every parameter on every SPC chart is in range. And the rejection rate this week is higher than last week. The chart is not wrong about the numbers. The chart is being asked to do a job it was not built for.
Read the full article to learn about SPC green sand, statistical process control foundry, SPC false alarms, green sand process control, foundry quality control, SPC alternative, physics-based process control.
See your own prediction accuracy
Upload your lab data. See your own predicted vs. actual accuracy, day by day. 15 minutes. No cost. No commitment.
Start Your Free Assessment